Project network
A project network is a graph (flow chart) depicting the sequence in which a project's terminal elements are to be completed by showing terminal elements and their dependencies. It is always drawn from left to right to reflect project chronology.[1]
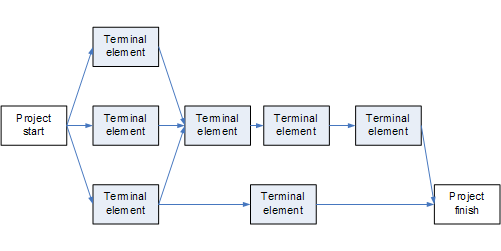
The work breakdown structure or the product breakdown structure show the "part-whole" relations. In contrast, the project network shows the "before-after" relations.
The most popular form of project network is activity on node (AON)(as shown above), the other one is activity on arrow (AOA).
The condition for a valid project network is that it doesn't contain any circular references.
Project dependencies can also be depicted by a predecessor table. Although such a form is very inconvenient for human analysis, project management software often offers such a view for data entry.
An alternative way of showing and analyzing the sequence of project work is the design structure matrix.
See also
- Float (project management)
- Gantt chart
- Project management
- Project planning
- Program Evaluation and Review Technique
- Bar chart
References
- ↑ "Project Network Diagram". projectauditors.com. Retrieved April 23, 2014.
External links
- Critical Path Mapping with Activity Network Diagrams
- Understand how scheduling tools works-Draw network diagram yourself