Vale of Glamorgan (UK Parliament constituency)
Coordinates: 51°25′44″N 3°21′04″W / 51.429°N 3.351°W
| Vale of Glamorgan | |
|---|---|
|
County constituency for the House of Commons | |
|
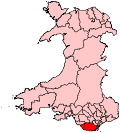
Boundary of Vale of Glamorgan in Wales. | |
| Preserved county | South Glamorgan |
| Electorate | 71,585 (December 2010)[1] |
| Major settlements | Barry, Llantwit Major, Cowbridge |
| Current constituency | |
| Created | 1983 |
| Member of parliament | Alun Cairns (Conservative) |
| Number of members | One |
| Created from | Barry and Pontypridd[2] |
| Overlaps | |
| Welsh Assembly | South Wales Central |
| European Parliament constituency | Wales |
Vale of Glamorgan (Welsh: Bro Morgannwg) is a county constituency in South Wales, represented in the House of Commons of the Parliament of the United Kingdom. It elects one Member of Parliament (MP), using the first-past-the-post voting system.
It is something of a bellwether, having been won by the party with a plurality of seats in every general election since the seat was created in 1983.
Boundaries
1983-2010: The Borough of Vale of Glamorgan wards of Baruc, Buttrills, Cadoc, Castleland, Court, Cowbridge, Dinas Powys, Dyfan, Gibbonsdown, Illtyd, Llandow, Llantwit Major, Peterson-super-Ely, Rhoose, St Athan, Sully, and Wenvoe.
2010-present: The Vale of Glamorgan County Borough electoral divisions of Baruc, Buttrills, Cadoc, Castleland, Court, Cowbridge, Dinas Powys, Dyfan, Gibbonsdown, Illtyd, Llandow and Ewenny, Llantwit Major, Peterston-super-Ely, Rhoose, St Athan, St Bride’s Major, and Wenvoe.
This marginal constituency to the west of Cardiff takes in the Labour-voting seaside resort of Barry and a number of Conservative villages and small towns. There have been some close shaves for both parties here in the past: Conservative Walter Sweeney got home by a mere 19 votes in 1992; and John Smith (namesake of the late previous Labour leader) had a majority of under 2,000 in 2005. John Smith stood down from Parliament due to ill health, and the seat went Conservative at the 2010 election.
Members of Parliament
| Election | Member[3] | Party | |
|---|---|---|---|
| 1983 | Sir Raymond Gower | Conservative | |
| 1989 by-election | John Smith | Labour | |
| 1992 | Walter Sweeney | Conservative | |
| 1997 | John Smith | Labour | |
| 2010 | Alun Cairns | Conservative | |
Elections
Elections in the 2010s
| Party | Candidate | Votes | % | ± | |
|---|---|---|---|---|---|
| Conservative | Alun Cairns | 23,607 | 46.0 | +4.2 | |
| Labour | Chris Elmore | 16,727 | 32.6 | −0.3 | |
| UKIP | Kevin Mahoney | 5,489 | 10.7 | +7.6 | |
| Plaid Cymru | Ian James Johnson | 2,869 | 5.6 | +0.1 | |
| Liberal Democrat | David Morgan[6] | 1,309 | 2.6 | −12.7 | |
| Green | Alan Armstrong | 1,054 | 2.1 | +1.1 | |
| CISTA | Steve Reed | 238 | 0.5 | +0.5 | |
| Majority | 6,880 | 13.4 | +4.6 | ||
| Turnout | 51,293 | 71.1 | +1.8 | ||
| Conservative hold | Swing | +2.3 | |||
| Party | Candidate | Votes | % | ± | |
|---|---|---|---|---|---|
| Conservative | Alun Cairns | 20,341 | 41.8 | +4.4 | |
| Labour | Alana E. Davies | 16,034 | 32.9 | −7.8 | |
| Liberal Democrat | Eluned Parrott | 7,403 | 15.2 | +2.0 | |
| Plaid Cymru | Ian James Johnson | 2,667 | 5.5 | +0.3 | |
| UKIP | Kevin Mahoney | 1,529 | 3.1 | +1.4 | |
| Green | Rhodri H. Thomas | 457 | 0.9 | +0.9 | |
| Christian | John Harrold | 236 | 0.5 | +0.5 | |
| Majority | 4,307 | 8.8 | |||
| Turnout | 48,667 | 69.3 | +0.7 | ||
| Conservative gain from Labour | Swing | +6.1 | |||
Elections in the 2000s
| Party | Candidate | Votes | % | ± | |
|---|---|---|---|---|---|
| Labour | John William Patrick Smith | 19,481 | 41.2 | −4.2 | |
| Conservative | Alun Cairns | 17,673 | 37.3 | +2.3 | |
| Liberal Democrat | Mark Hooper | 6,140 | 13.0 | +0.8 | |
| Plaid Cymru | Barry Shaw | 2,423 | 5.1 | −1.2 | |
| UKIP | Richard Suchorzewski | 840 | 1.8 | +0.8 | |
| Liberal | Karl-James Langford | 605 | 1.3 | +1.3 | |
| Socialist Labour | Paul Mules | 162 | 0.3 | +0.3 | |
| Majority | 1,808 | 3.8 | |||
| Turnout | 47,324 | 68.9 | +2.2 | ||
| Labour hold | Swing | −3.3 | |||
| Party | Candidate | Votes | % | ± | |
|---|---|---|---|---|---|
| Labour | John William Patrick Smith | 20,524 | 45.4 | −8.5 | |
| Conservative | Lady Susan Lilian Inkin | 15,824 | 35.0 | +0.7 | |
| Liberal Democrat | Dewi Hywel Smith | 5,521 | 12.2 | +3.0 | |
| Plaid Cymru | Chris Franks | 2,867 | 6.3 | +3.8 | |
| UKIP | Timothy Niall Warry | 448 | 1.0 | N/A | |
| Majority | 4,700 | 10.4 | |||
| Turnout | 45,184 | 66.7 | −13.3 | ||
| Labour hold | Swing | ||||
Elections in the 1990s
| Party | Candidate | Votes | % | ± | |
|---|---|---|---|---|---|
| Labour | John William Patrick Smith | 29,054 | 53.9 | +9.6 | |
| Conservative | Walter Sweeney | 18,522 | 34.4 | −9.9 | |
| Liberal Democrat | Mrs. Suzanne Margaret Campbell | 4,945 | 9.2 | +0.0 | |
| Plaid Cymru | Mrs. Melanie Jane Corp | 1,393 | 2.6 | +0.5 | |
| Majority | 10,532 | 19.5 | N/A | ||
| Turnout | 53,914 | 80.0 | −1.9 | ||
| Labour gain from Conservative | Swing | +9.8 | |||
| Party | Candidate | Votes | % | ± | |
|---|---|---|---|---|---|
| Conservative | Walter Sweeney | 24,220 | 44.3 | −2.4 | |
| Labour | John William Patrick Smith | 24,201 | 44.3 | +9.6 | |
| Liberal Democrat | David Keith Davies | 5,045 | 9.2 | −7.4 | |
| Plaid Cymru | David Brian Langham Haswell | 1,160 | 2.1 | +0.3 | |
| Majority | 19 | 0.0 | −12.0 | ||
| Turnout | 54,626 | 81.9 | +2.6 | ||
| Conservative gain from Labour | Swing | ||||
Elections in the 1980s
| Party | Candidate | Votes | % | ± | |
|---|---|---|---|---|---|
| Labour | John William Patrick Smith | 23,342 | 48.9 | +14.2 | |
| Conservative | Rod Richards | 17,314 | 36.3 | −10.5 | |
| Social and Liberal Democrats | Frank Leavers | 2,017 | 4.2 | −12.5 | |
| Plaid Cymru | Andrew John Dixon | 1,672 | 3.5 | +1.7 | |
| Social Democratic | David Keith Davies | 1,098 | 2.3 | N/A | |
| Green | Mrs. Marilyn Wakefield | 971 | 2.0 | N/A | |
| Protect the Health Service | Christopher Tiarks | 847 | 1.8 | N/A | |
| Monster Raving Loony | Screaming Lord Sutch | 266 | 0.5 | N/A | |
| Independent Welsh Socialist | Eric Roberts | 148 | 0.3 | N/A | |
| Corrective Party | Lindi St Claire | 39 | 0.1 | N/A | |
| Christian Alliance | David Michael Black | 32 | 0.1 | N/A | |
| Majority | 6,028 | 12.6 | N/A | ||
| Turnout | 47,746 | 70.7 | |||
| Labour gain from Conservative | Swing | −12.4 | |||
| Party | Candidate | Votes | % | ± | |
|---|---|---|---|---|---|
| Conservative | Sir Raymond Gower | 24,229 | 46.8 | −1.2 | |
| Labour | John William Patrick Smith | 17,978 | 34.7 | +8.9 | |
| Social Democratic | David Keith Davies | 8,633 | 16.7 | −7.2 | |
| Plaid Cymru | Penri Gwyn Williams | 946 | 1.8 | −0.5 | |
| Majority | 6,251 | 12.1 | |||
| Turnout | 51,786 | 79.3 | +5.1 | ||
| Conservative hold | Swing | −5.1 | |||
| Party | Candidate | Votes | % | ± | |
|---|---|---|---|---|---|
| Conservative | Sir Raymond Gower | 22,241 | 48.0 | N/A | |
| Labour | Michael Edwin Sharp | 12,028 | 25.8 | N/A | |
| Social Democratic | William Alan Evans | 11,154 | 23.9 | N/A | |
| Plaid Cymru | Andrew John Dixon | 1,068 | 2.3 | N/A | |
| Majority | 10,393 | 22.2 | N/A | ||
| Turnout | 46,671 | 74.2 | N/A | ||
| Conservative win (new seat) | |||||
See also
Notes and references
- ↑ "Beyond 20/20 WDS - Table view". 2011 Electorate Figures. StatsWales. 1 December 2010. Retrieved 13 March 2011.
- ↑ "'Vale of Glamorgan', June 1983 up to May 1997". ElectionWeb Project. Cognitive Computing Limited. Retrieved 14 March 2016.
- ↑ Leigh Rayment's Historical List of MPs – Constituencies beginning with "V"
- ↑ "Election Data 2015". Electoral Calculus. Archived from the original on 17 October 2015. Retrieved 17 October 2015.
- ↑ "Vale of Glamorgan result" (PDF). Statement of Results. Vale of Glamorgan Council. Retrieved 20 September 2015.
- ↑ http://www.libdems.org.uk/list_of_selected_candidates#
- ↑ "Election Data 2010". Electoral Calculus. Archived from the original on 17 October 2015. Retrieved 17 October 2015.
- ↑ Vale of Glamorgan, Vale of Glamorgan County Borough Council - candidates - Vale of Glamorgan
- ↑ Vale of Glamorgan BBC Election - Vale of Glamorgan
- ↑ "Election Data 2005". Electoral Calculus. Archived from the original on 15 October 2011. Retrieved 18 October 2015.
- ↑ "Election Data 2001". Electoral Calculus. Archived from the original on 15 October 2011. Retrieved 18 October 2015.
- ↑ "Election Data 1997". Electoral Calculus. Archived from the original on 15 October 2011. Retrieved 18 October 2015.
- ↑ "Election Data 1992". Electoral Calculus. Archived from the original on 15 October 2011. Retrieved 18 October 2015.
- ↑ "Politics Resources". Election 1992. Politics Resources. 9 April 1992. Retrieved 2010-12-06.
- ↑ "Election Data 1987". Electoral Calculus. Archived from the original on 15 October 2011. Retrieved 18 October 2015.
- ↑ "Election Data 1983". Electoral Calculus. Archived from the original on 15 October 2011. Retrieved 18 October 2015.