Dutch general election, 1959
Dutch general election, 1959
|
|
|
|
All 150 seats to the House of Representatives
76 seats were needed for a majority |
| Turnout |
95.6% |
| |
First party |
Second party |
Third party |
| |
 |
 |
 |
| Leader |
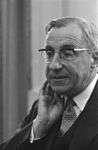
Jan de Quay |
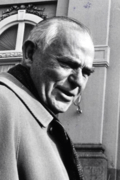
Jaap Burger |
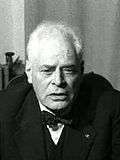
Pieter Oud |
| Party |
KVP |
PvdA |
VVD |
| Leader since |
1959 |
1952 |
1948 |
| Last election |
49 seats, 31.7% |
50 seats, 32.7% |
13 seats, 8.8% |
| Seats won |
49 |
48 |
19 |
| Seat change |
 |
 2 2 |
 6 6 |
| Popular vote |
1,895,914 |
1,821,285 |
732,658 |
| Percentage |
31.6% |
30.4% |
12.2% |
|
| |
Fourth party |
Fifth party |
Sixth party |
| |
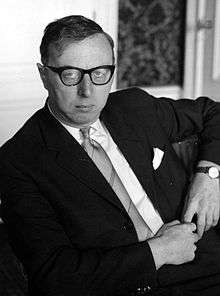 |
 |
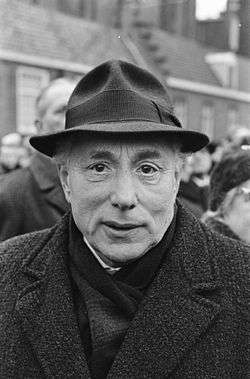 |
| Leader |
Jelle Zijlstra |
Henk Beernink |
Paul de Groot |
| Party |
ARP |
CHU |
CPN |
| Leader since |
1956 |
1959 |
1946 |
| Last election |
15 seats, 9.9% |
13 seats, 8.4% |
7 seats, 4.7% |
| Seats won |
14 |
12 |
3 |
| Seat change |
1 |
1 |
4 |
| Popular vote |
563,091 |
486,429 |
144,542 |
| Percentage |
9.4% |
8.1% |
2.4% |
|
| |
Seventh party |
Eighth party |
| |
 |
 |
| Leader |
Pieter Zandt |
Henk Lankhorst
Nico van der Veen |
| Party |
SGP |
PSP |
| Leader since |
1945 |
1959 |
| Last election |
3 seats, 2.3% |
First Election |
| Seats won |
3 |
2 |
| Seat change |
|
2 |
| Popular vote |
129,678 |
110,499 |
| Percentage |
2.2% |
1.8% |
|
|
| Seats |
|
|
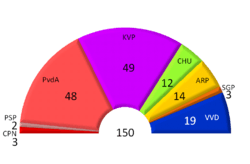
General elections were held in the Netherlands on 12 March 1959.[1] The Catholic People's Party emerged as the largest party, winning 49 of the 150 seats in the House of Representatives.[2]
Results
| Party |
Votes |
% |
Seats |
+/– |
|---|
| Catholic People's Party | 1,895,914 | 31.6 | 49 | 0 |
| Labour Party | 1,821,285 | 30.4 | 48 | –2 |
| People's Party for Freedom and Democracy | 732,658 | 12.2 | 19 | +6 |
| Anti Revolutionary Party | 563,091 | 9.4 | 14 | –1 |
| Christian Historical Union | 486,429 | 8.1 | 12 | –1 |
| Communist Party of the Netherlands | 144,542 | 2.4 | 3 | –4 |
| Reformed Political Party | 129,678 | 2.2 | 3 | 0 |
| Pacifist Socialist Party | 110,499 | 1.8 | 2 | New |
| Farmers' Party/Party for Agriculture and the Middle Class | 115,435 | 2.0 | 0 | New |
| Reformed Political League | 0 | 0 |
| Brug Group | 0 | New |
| Positive Christian National Union | 0 | New |
| Invalid/blank votes | 143,878 | – | – | – |
| Total | 6,143,409 | 100 | 150 | 0 |
| Registered voters/turnout | 6,427,864 | 95.6 | – | – |
| Source: Nohlen & Stöver |
| Popular Vote |
|---|
|
|
|
|
|
| KVP |
|
31.60% |
| PvdA |
|
30.36% |
| VVD |
|
12.21% |
| ARP |
|
9.39% |
| CHU |
|
8.11% |
| CPN |
|
2.41% |
| SGP |
|
2.16% |
| PSP |
|
1.84% |
| GPV |
|
0.67% |
| BP/PLM |
|
0.66% |
| Other |
|
0.60% |
References
- ↑ Nohlen, D & Stöver, P (2010) Elections in Europe: A data handbook, p1396 ISBN 978-3-8329-5609-7
- ↑ Nohlen & Stöver, p1413